By Mariam Melkumyan
You have spent days, weeks, or months collecting data and now need to analyze and see if anything is significant. You look at your data and realize that the statistics classes you took did not prepare you for the actual application of the statistics. You look at your options for analysis and see things like one-sample t-test, paired t-tests, one-way ANOVA, two-way ANOVA, etc. These terms may seem familiar to you, as you have heard them and probably used them in your statistics courses, but how do you go about applying them to your data?
Before we get into it, I want to preface this by saying that this article is meant to present ideas on when to apply the specific types of tests, not deep dive into details and math behind how statistical analyses work. So, let’s define these tests and use examples to figure out when to use them.
T-tests
The Student’s t-test was developed in 1908, when William Sealy Gosset, under the pseudonym Student, developed the test to handle small samples for quality control in brewing at the Guinness brewery in Dublin. T-tests are used to compare a variable between two groups. These variables can be dependent or independent. An independent variable is a variable that the experimenter can control, such as an injection of a specific drug. A dependent variable is what is being measured in an experiment. There are multiple types of t-tests used in different scenarios (Figure 1).
One-sample t-tests (Figure 1A)are used to compare variables to a known constant or a hypothetical mean. For example, if an experimenter wants to look at the effect of the drug in one group and they want to compare it to the hypothetical value of 100, they will use a one-sample t-test. This comparison tells the researcher if the drug had an effect compared to the hypothetical value of 100 or if there was no significant change from 100.
Unpaired t-tests (Figure 1B)are used to compare one variable between two groups. Unpaired t-tests let you know whether the means of the two groups are significantly different. For unpaired t-tests it is important to have two distinct groups. In other words, don’t use unpaired t-test if you are trying to compare an effect of an intervention before and after the intervention. For an experiment measuring anxiety-like behavior in a group of mice that had drug A compared to a group of mice that had drug B, a researcher should use an unpaired t-test. Notice that the groups of mice are distinct from each other.
Paired t-tests (Figure 1C) are used to compare variables from the same population or variables from two related populations. For example, if an experiment was testing the anxiety-like behavior of mice before injection of drug A and after the injection using the same group of mice, the researcher would need to use a paired t-test. Other times when using a paired t-test is necessary is when you run an experiment at two timepoints, each time having the control and experimental groups handled in parallel. The GraphPad Statistic guide has multiple examples of when to use unpaired vs paired t-test (see page 257).

But what if you have more than two groups?
ANOVA
Analysis of Variance (ANOVA) is used to compare the means of three or more groups. ANOVA is used when there is only one dependent variable, which in the examples below is the anxiety-like behavior of the mice. Just like t-tests, there are multiple types of ANOVA tests (see Figure 2).
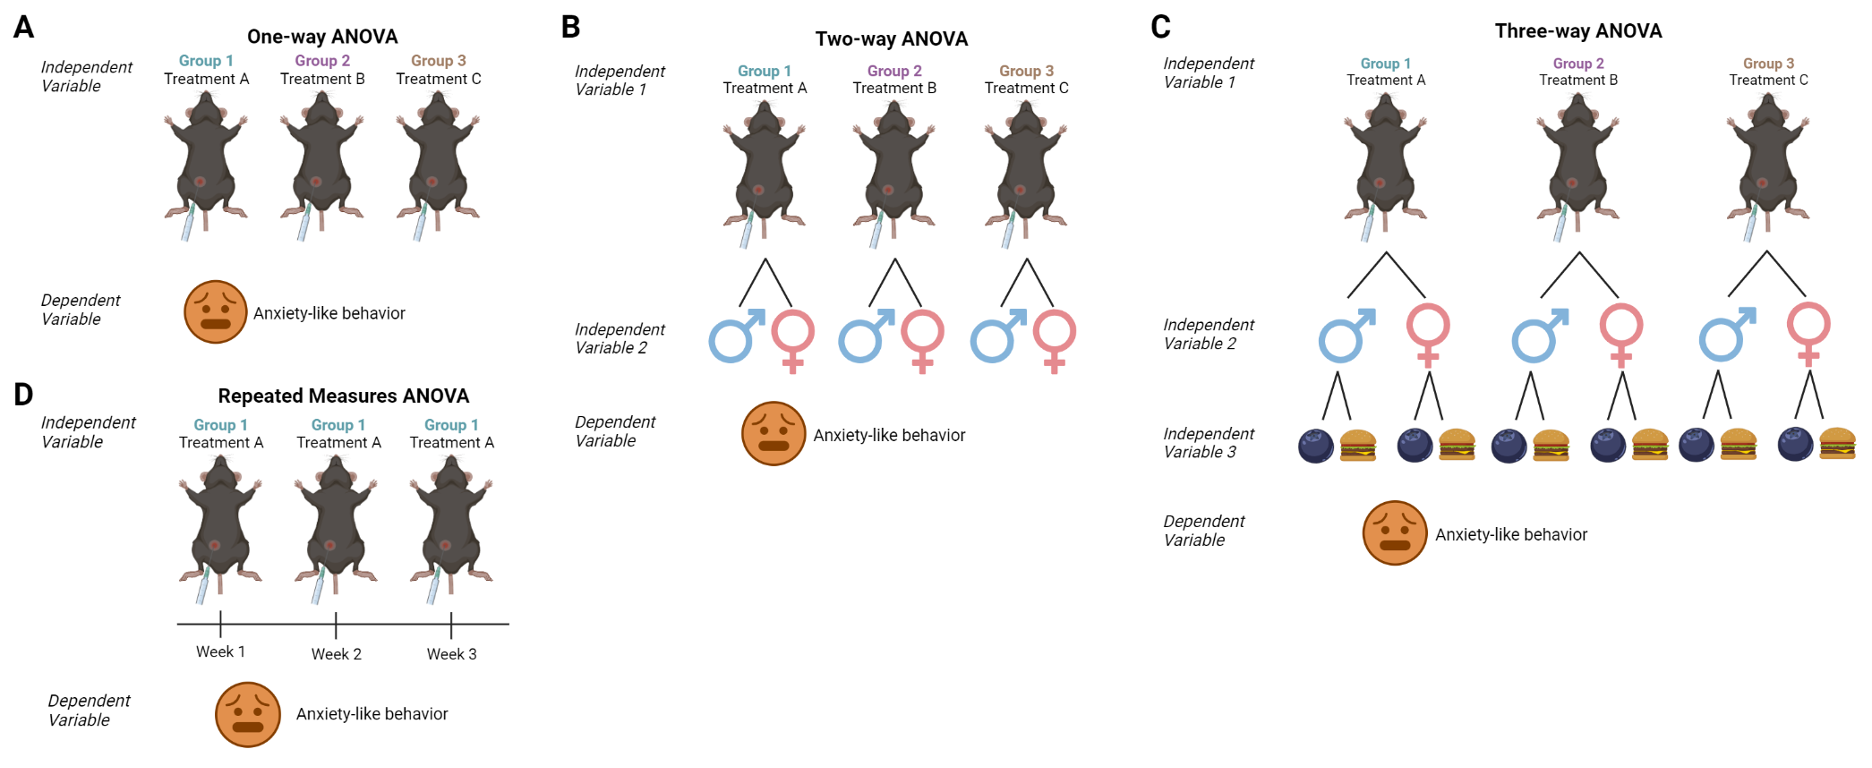
One-way ANOVA (Figure 2A) is used to compare one dependent variable between groups. For example, for three different treatment condition groups looking at the anxiety-like behavior of mice, one would use a one-way ANOVA to look for statistical significance. Here the independent variable is the treatment condition, while the dependent variable is the anxiety-like behavior of mice.
Two-way ANOVA (Figure 2B) is used to compare two independent variables between groups. For example, if in addition to my three different treatment conditions, I also wanted to look at sex as a second independent variable leading to differences in anxiety-like behavior, I would use two-way ANOVA. A two-way ANOVA will give you three different p-values. Two of those p-values are of the main effect, in this example it would be a p-value for treatment and a p-value for sex, and one is of the interaction between treatment and sex.
Three-way ANOVA (Figure 2C) is used to compare three independent variables between groups. Building off of the previous example, if I also wanted to add diet as a factor in addition to sex and treatment type, I would use a three-way ANOVA. The three-way ANOVA would then allow me to look at the effect of diet (high fat vs normal), sex (male vs female), and drug treatment on anxiety-like behavior. A three-way ANOVA would give you six p-values. Three of those would be of the main effect, in this case treatment, sex, and diet, and three would be of the interactions (treatment x sex, treatment x diet, diet x sex).
Repeated measures ANOVA (Figure 2D) is similar to a paired t-test, except it is used for more than 2 groups. Repeated measures ANOVA is equivalent to one-way ANOVA, with the exception that the groups are not independent from each other. For example, if there are three different treatments on the same group of mice at different timepoints, comparing their anxiety-like behavior in response to treatment would require a repeated measures ANOVA. A repeated measures ANOVA gives you three p-values, two of which are for the main effect of the outcome of interest (anxiety-like behavior) and the different timepoints, and one is for the interaction between the outcome of interest and time.
It is worth noting that a significant result in ANOVA only implies that there is a significant difference between your groups. To find out which groups are statistically different from each other, you can use multiple comparisons, a test used to conduct analyses of all possible pairwise means when your ANOVA shows a significant result. Keep in mind that if your ANOVA is not significant, using multiple comparisons can give erroneous conclusions. However, even if your ANOVA is significant, use multiple comparisons with caution, as multiple comparisons can provide false positives if the appropriate corrections, such as Bonferroni, Tukey, or Sidak corrections, are not used. GraphPad Prism has good explanations on when to use the different types of corrections for multiple comparisons.
There are more types of ANOVA tests that one can use in certain situations, which are explained very nicely by Qualtrics. If you are using a statistical software such as GraphPad, the software usually recommends the correct type of test that should be used for your particular dataset and is a great start to your statistical adventure.
However, what test should you use if you have more than one dependent variable?
Multivariate regression/analysis comes into play when looking at multiple dependent variables. Multivariate analysis is used to assess whether various independent variables and various dependent variables are linearly related to each other. Multivariate analysis is therefore used for complex data sets and is conducted using statistical software like SPSS or programming languages, like R. If you are interested in learning more about multivariate statistics and multivariate modeling, there many resources explaining what multivariate analyses are and when it is appropriate to use these models.
The above-mentioned tests are just a glimpse of the statistical world of data analysis. There are many resources available both inside and outside of PSCOM to help you learn more about statistical analyses. If you are struggling with statistical analysis, you can get four hours of free consultation at PSUCOM to help with your research design and analysis. Outside of PSU, GraphPad Prism has many articles and resources regarding analysis and types of tests to use. As mentioned above, Nature has a collection called Statistics for Biologists which explores different aspects of statistics, including power analyses and statistical tests. If you prefer to watch videos rather than read articles, Khan Academy has many spectacular videos explaining complex statistical ideas. Lastly, there are many free online statistical courses on websites like Coursera and edX that can help you learn more in-depth details about statistical analysis.
Good luck with your research and I hope this article was significant for you!
TL:DR
- Use t-tests for when you are comparing two groups
- Use ANOVA when you are comparing more than two groups and one or more independent variables (one-way for one variable, two-way for two variables, three-way for three variables)
