Xinying Fang, Ph.D. candidate in Biostatistics
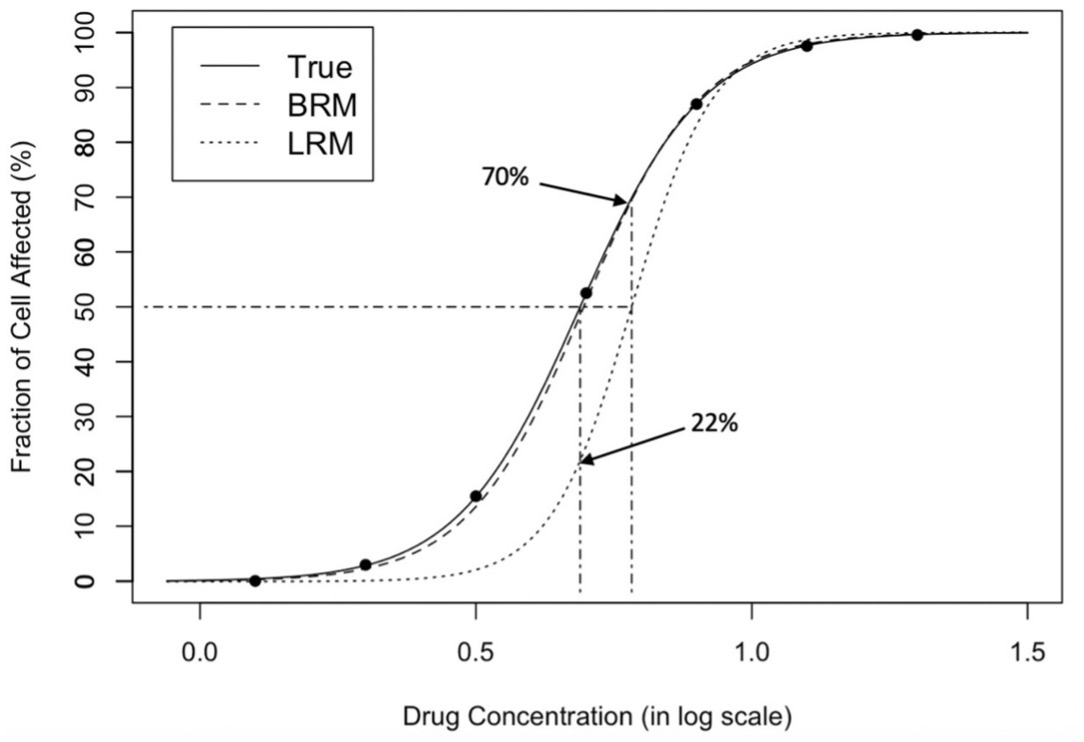
In drug development, it is very important to understand how the dose of a drug relates to its effectiveness, a relationship known as the dose-response curve. Scientists often use a formula called the median effect equation to understand this relationship, but there are some issues with using a simple linear relationship to estimate this formula (so called linear regression). When they’re planning experiments and collecting data, they might not know exactly what the dose-response curve looks like. So sometimes, scientists end up with data that seems really extreme –the drug either works perfectly or not at all. This extreme data can mess up the conclusions about how well the drug actually works. The usual way of analyzing the data doesn’t work great when these extreme points are present, as shown in Figure 1.
To overcome the challenges posed by extreme observations, our research endeavors to introduce innovative methods for estimating dose-response curves. By doing so, we seek to enhance the accuracy and reliability of drug effectiveness assessments, ensuring that our conclusions are more robust and trustworthy.
What Was Known Before My Findings:
Before our research, scientists had already developed various mathematical frameworks to study how a drug’s effectiveness changes with its dosage1. Among them, the most commonly used model is the median effect equation.
The median-effect equation is a way of explaining complex enzyme activities using a simple rule called the mass-action law principle. This method helps us understand many different types of enzyme reactions2. The median-effect equation is termed as:
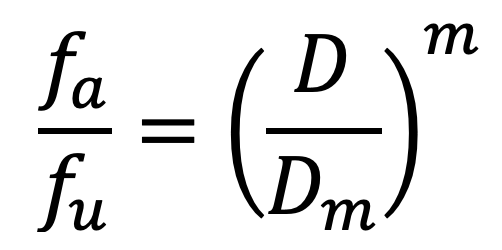
where fa and fu are the cell fractions of the system affected and unaffected by the dose level D. Dm is the dose level corresponding to the median effect, e.g., IC50 (half maximal inhibitory concentration), ED50 (half-maximum effective dose), or LD50 (median lethal dose) values. m, also called the Hill coefficient, is the sigmoidicity of the median-effect curve.
Given the fact that fa + fu = 1, the equation can be simplified to:
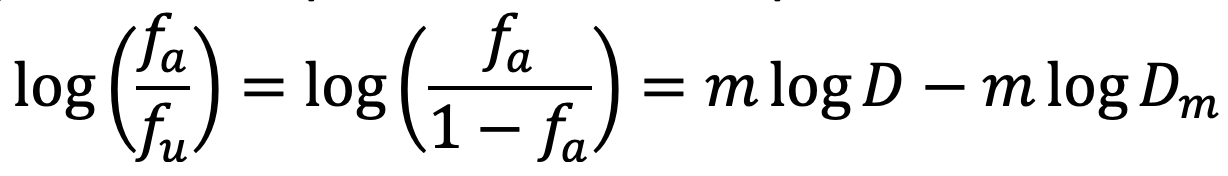
The dose-response curve becomes steeper when the magnitude of m increases. When m is negative/positive, the estimated drug effects decreases/increases as drug concentration increases.
Using the median effect equation, researchers can generate a dose-response curve, identifying how the drug’s effect changes as the dosage varies. A dose-response curve can also be used to determine the median effect dose levels, which are achieved by Dm in Eqn. 2 and are commonly used to compare dose-response curves. The median effect dose levels along with the dose-response curve help us understand the relationship between drug dosage and drug impact.
My Main Question:
How can we improve the accuracy and robustness of the dose-response curve estimation in drug discovery, particularly in situations where the experimental data include extreme responses? In other words, we were looking for a better method to understand how the effectiveness of a drug changes with the dose, even when there are very high or very low values in the data.
What I Did to Answer the Question:
To tackle the challenge, we developed a novel method called Robust and Efficient Assessment of Potency (REAP) for estimating dose-response relationships3. REAP is a statistical approach based on a robust beta regression. Compared to the standard linear regression which measures a straight-line relationship for continuous data, beta regression allows more flexibility and fits To tackle the challenge, we developed a novel method called Robust and Efficient Assessment of Potency (REAP) for estimating dose-response relationships3. REAP is a statistical approach based on a robust beta regression. Compared to the standard linear regression which measures a straight-line relationship for continuous data, beta regression allows more flexibility and fits better when dealing with data that are in the 0 to 1 range, like proportions or percentages. To ensure the reliability of REAP, we conducted several simulation studies comparing REAP with the conventional linear regression estimation method.
The simulation study results (Fig. 2)3 revealed that when extreme observations were present in the data, the robust beta regression method (Blue in Fig. 2) provided more accurate estimates and exhibited fewer errors compared to the traditional approach (Red and Green in Fig. 2). Additionally, the robust beta regression method showed better precision in estimating the range of likely values (represented by 95% confidence intervals). In summary, the robust beta regression proved to be a more accurate, precise, and reliable alternative to the standard linear regression.

Following REAP, we carried out a thorough comparative study to assess 14 different estimation tools available in R, along with various versions of beta regressions4. Our objective was to evaluate how well these tools could estimate dose-response curves when extreme observations were present in the data. To achieve this, we employed a technique known as a Monte Carlo simulation, which allows us to mimic a wide range of scenarios that researchers might encounter in real-world drug development.
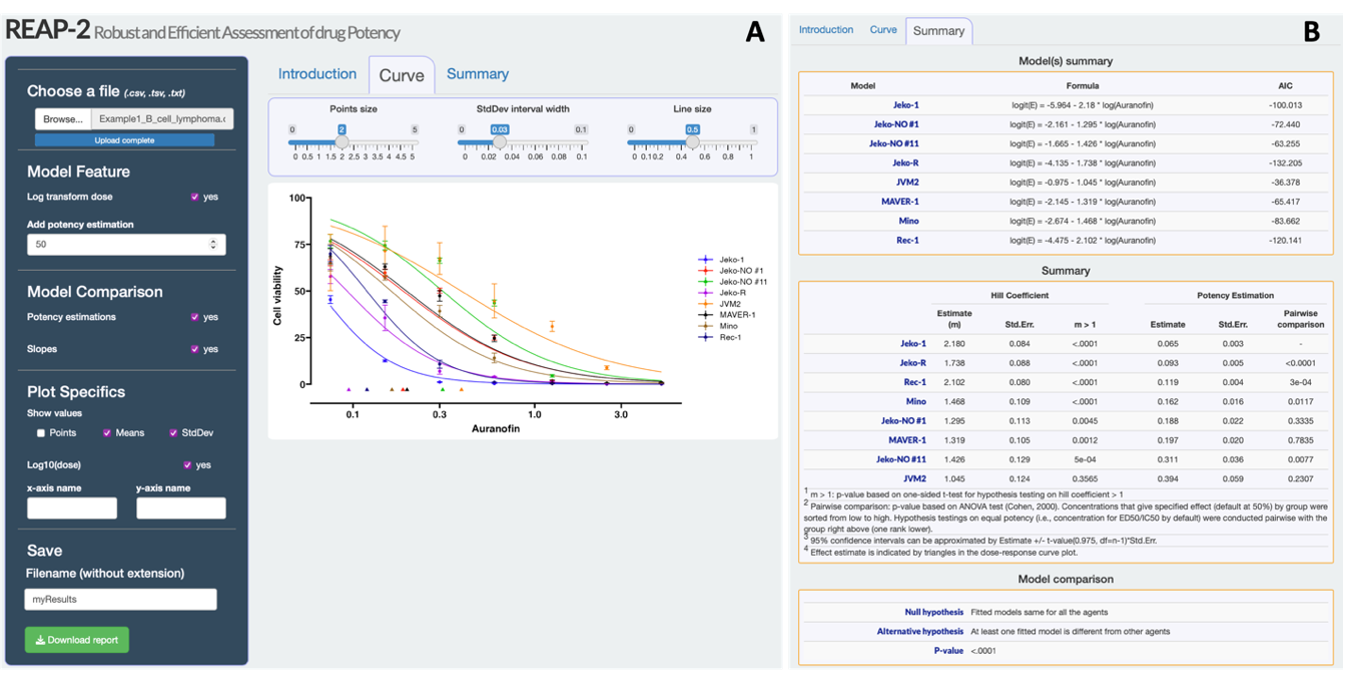
Through our analysis, we discovered that a specific method called penalized beta regression, which is implemented in the mgcv package in R5, outperformed other approaches. This penalized beta regression method demonstrated remarkable stability and accuracy in estimating dose-response curves, even when dealing with extreme observations. Additionally, it offered reliable quantification of uncertainty4. Based on the selected penalized beta regression with the mgcv package, we redesigned the user interface of REAP and updated the estimation algorithm to estimate the dose-response. The updated tool, named REAP-2, is freely available and accessible at https://xinying-fang.shinyapps.io/REAP/ (Fig. 3). These findings emphasize the superior performance of the penalized beta regression in handling extreme data points, further reinforcing its suitability for precise and reliable dose-response curve estimation. Using REAP-2, researchers gain the ability to generate dose-response curve plots and estimations, enabling the assessment of drug potencies and facilitating comparisons between various compounds. This is achieved by simply uploading the in vitro dose-response dataset.
If You Would Like to Learn More About My Research:
REAP-2 Shiny App: https://xinying-fang.shinyapps.io/REAP/
Fang, X., & Zhou, S. (2023). A comparative study of in vitro dose–response estimation under extreme observations. Biometrical Journal. https://doi.org/10.1002/bimj.202200092
Zhou, S.*, Liu, X.*, Fang, X.*, Chinchilli, V. M., Wang, M., Wang, H.-G., Dokholyan, N. V, Shen, C., & Lee, J. J. (2022). Robust and Efficient Assessment of Potency (REAP) as a quantitative tool for dose-response curve estimation. ELife, 11. https://doi.org/10.7554/eLife.78634
TL:DR
- REAP (Robust and Efficient Assessment of Potency) employs a robust beta regression framework to significantly improve the accuracy of dose-response curve estimation, particularly when dealing with extreme observations.
- Following REAP, we conducted a simulation study in R. The study revealed that penalized beta regression is the superior and reliable method for handling extreme observations and quantifying uncertainty in dose-response curves.
- We developed a Shiny app, named REAP-2, to implement the penalized beta regression. It can be freely accessed at https://xinying-fang.shinyapps.io/REAP/.
References
- Ritz, C., Baty, F., Streibig, J. C. & Gerhard, D. Dose-response analysis using R. PLoS One 10, 1–13 (2015).
- Greco, W. R., Bravo, G. & Parsons, J. C. The search for synergy: a critical review from a response surface perspective. Pharmacol. Rev. 47, 331–85 (1995).
- Zhou, S. et al. Robust and Efficient Assessment of Potency (REAP) as a quantitative tool for dose-response curve estimation. Elife 11, (2022).
- Fang, X. & Zhou, S. A comparative study of in vitro dose–response estimation under extreme observations. Biometrical J. (2023) doi:10.1002/bimj.202200092.
- Wood, S. N. Generalized Additive Models. (Chapman and Hall/CRC, 2017). doi:10.1201/9781315370279.
